Despite all the economic uncertainties, dizzying headlines, and volatilities, the stock market has held up surprisingly well. The overall market, as measured by S&P 500, is 7.1% above its previous record high (Sept, 2018). In a strong market, value investors tend to see fewer opportunities due to higher valuations. However, we haven’t observed a dwindling number of opportunities in our universe. We believe the main reason is that the recent performance in the stock market is somewhat bifurcated.
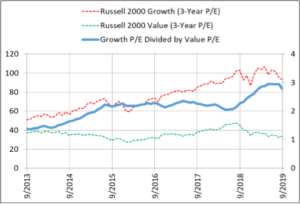
First, although the S&P 500 is at a record high, the Russell 2000 (small caps) is still 6.5% below the high achieved in 3rd quarter of 2018. There is enough pessimism built into the small-cap space. Secondly, value stocks continued to be shunned in favor of growth stocks. To demonstrate this point, we updated the above chart we included in our newsletter a year ago, which shows the P/Es of Russell 2000 Growth and Russell 2000 Value.
The gap between the Russell 2000 Growth P/E (red dash line) and Russell 2000 Value P/E (green dash line) has continued to widen (the left axis shows the actual P/E). To better quantify this gap, the solid blue line is the ratio of these two P/E’s (ratios shown on the right axis). As you can see, this ratio was hitting new highs until September, when value stocks clawed back some of valuation gap. Still small cap growth stock relative valuations remain near 6 year highs, as seen in this chart. Before this year, you would have to go back to December 2003 to see relative valuations this high. For value investors, valuation is everything, and this chart helps confirm the observations we had made in our day-to-day screens and research: There are many attractive investment opportunities in the small-cap value space. In fact, it may be the best since the financial crisis.
A few words on how this chart is done without getting too technical: we used 3-year rolling P/E, rather than yearly P/E, to smooth out the annual volatilities, so they make sense visually. Year-over-year earnings can fluctuate very significantly (big writedowns, one-time gains, etc.), which would obscure the pattern. In addition, when calculating the P/E, we used actual earnings. You may think, what else would you use? Well, very often, the way the P/E is presented for Russell indices excludes negative earnings. That’s an inaccurate portrayal to say the least.
Our conclusion is that the reason the P/E gap is so huge right now is investors have continued to pile into growth stocks, driving up their prices, while these companies’ earnings have in fact gone down in the last several years (Tell us again why they are the growth stocks?). This year’s IPOs collectively have been the least profitable of all the years since the tech bubble. This trend is also apparent in small-cap growth land. When investors are so enamored with growth and forget the importance of earnings, it creates an environment that gives value investors the most opportunities. We had been through this cycle before, and we’re excited to position our portfolios to best take advantage in this environment.