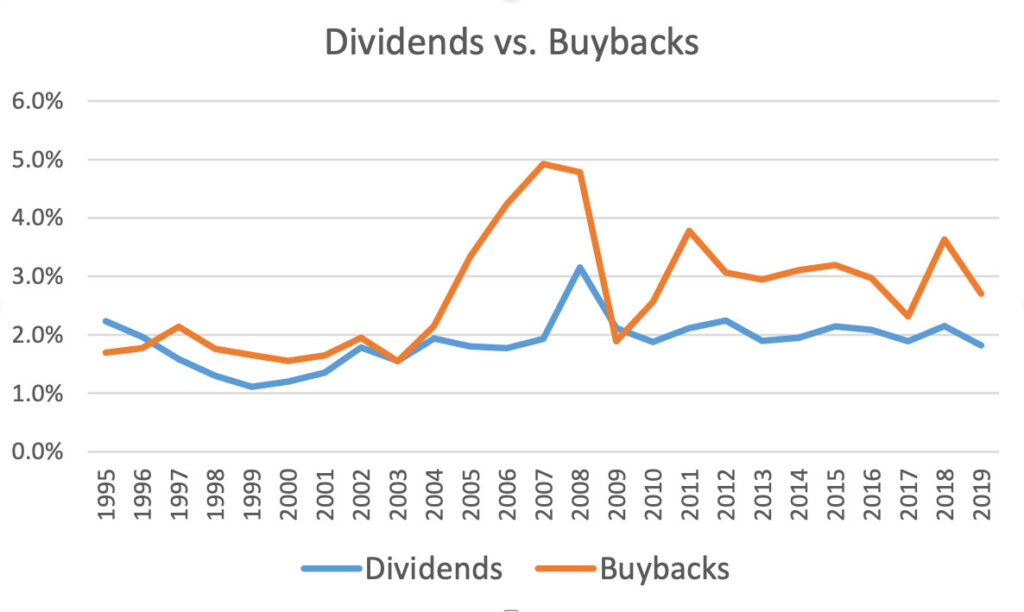
This is a chart of dividends vs. buybacks for S&P 500 in the last 25 years. We picked S&P 500 as the point of discussion because it’s more representative of the general U.S. stock market and has reliable data. For illustration purposes, we calculated “buyback yield” by dividing buyback per share by the stock price, similar to how dividend yield is calculated. As you can see, buybacks have actually exceeded dividends paid over the years (although currently many companies have suspended buybacks, as is typical in a recession).
In addition to distributing profits as dividends or buybacks, businesses can choose to reinvest (building a new factory, developing new products, expanding in new geographies, etc.). Or it can pursue acquisitions to achieve revenue and/or cost synergies. The success of these two activities largely depends on the industry dynamics and competence of management. However, taken together, they create more products and services with more efficiencies, or in other words, economic growth.
You may have heard that the stock market has achieved a 6-8% annualized return historically (it varies depending on which time period you choose; past performance is absolutely no guarantee for future performance). Roughly speaking, that’s 2% dividends, 2%+ buybacks, and the rest in nominal growth and change in valuation multiples. Over the long run, stock returns depend on its future earnings (and how they’re allocated), and that’s why we constantly refer to them.