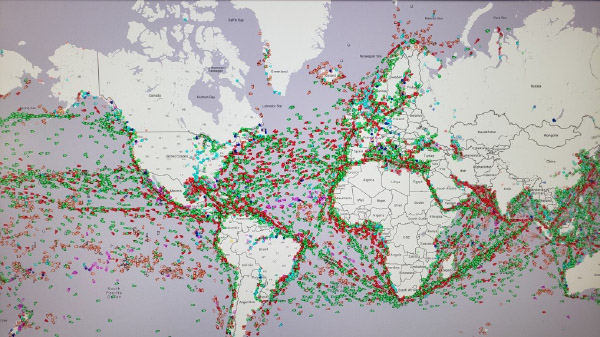
This is a global image of all maritime traffic on the first morning of the first business day of 2021 (tankers are colored red, cargo are green, fishing is orange). Ships transmit a GPS signal that allows for real time data, a useful tool. Early in 2020, estimates for the shipping industry were dire. With trade wars continuing and then factories closing temporarily due to Covid-19 followed by drops and shifts in demand, massive shipping disruption occurred. Changes in demand for various items helpful to people who were hunkered down, such as home protective and exercise equipment soared and has yet to be satiated.
The anticipated drop in shipping and trade was lower than expected and the rebound was faster, with many areas of the shipping industry having a banner year. The port of Los Angeles had the highest August in its history. Estimates are, no surprise, for increased shipping and trade in 2021. The image in the top right of the picture is a zoomed in snapshot of Southern California to the northern section of Baja California, Mexico.
The cluster of blue arrows (approximately 14), represent cruise ships, drifting, like ghost ships, just outside U.S. waters. This is an interesting tool for tracing the global economy. Other uses could be to count all of the cruise ships by each publically traded company to see which ones are in use or “drifting” and match this against what the companies are saying.